Taxonomy & themes
Taxonomy and themes
Taxonomy is the labeling system you define: dimensions such as product area, segment, or severity, with values your team agrees to use. Use it for filters and rollups leadership can trust.
Themes are semantic groupings from the language in your evidence. They can nest (sub-themes) so you can browse how topics cluster without adding every phrase to the taxonomy.
Import a few items first so you have real insights to work with (Evidence → insights). Admins configure dimensions in the product; this guide explains what PMs and leads should expect.
Rich workspace context (products, OKRs, personas, docs) helps classification suggestions match how your company works. Details: Workspace context.
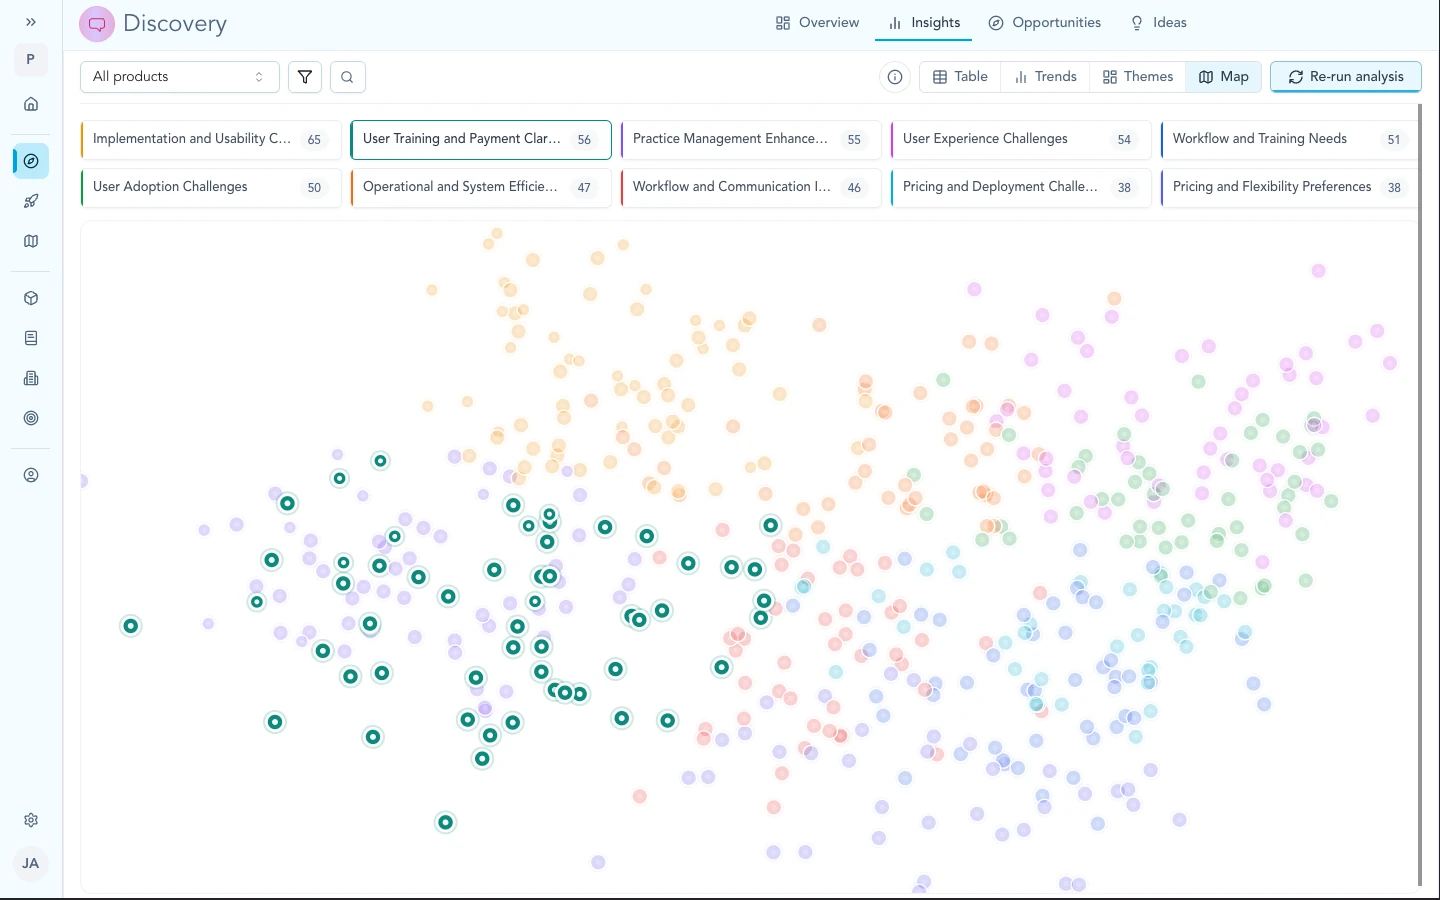
The map can show taxonomy (your dimensions) or themes (semantic clusters). Use whichever lens fits reporting or exploration.
Taxonomy and themes
Use taxonomy when you need stable answers: “everything tagged Enterprise,” “rollup by surface,” quarter-over-quarter counts.
Use themes when you want to explore: what customers keep saying, how wording clusters, which subtopics sit under a broader pain. Themes update as language in your corpus changes.
The same map can show taxonomy colors or theme navigation. Pick the lens that matches the conversation: reporting vs exploration.
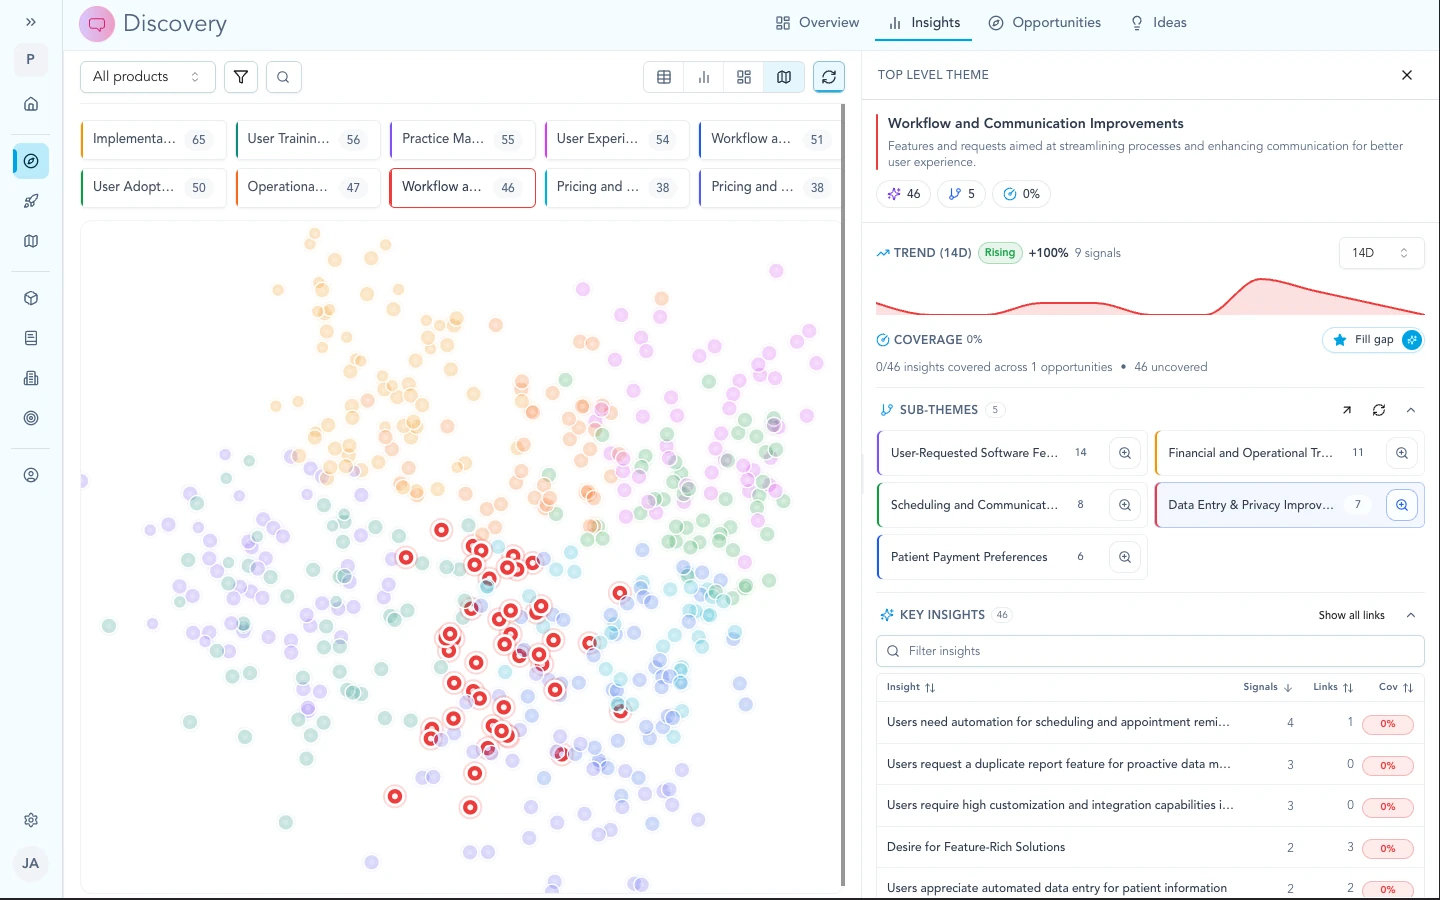
Themes nest into sub-themes so you can browse how language clusters, separate from your formal taxonomy dimensions.
Building your taxonomy
Dimensions apply to insights, ideas, and opportunities in your workspace. Each dimension can be free text, single-select, or multi-select, depending on how tight you want the vocabulary.
Describe each dimension in plain language. That text is part of how Zentrik suggests values when you classify.
You can start small: a few fields that match questions leadership already asks, then add or refine dimensions as imports grow.
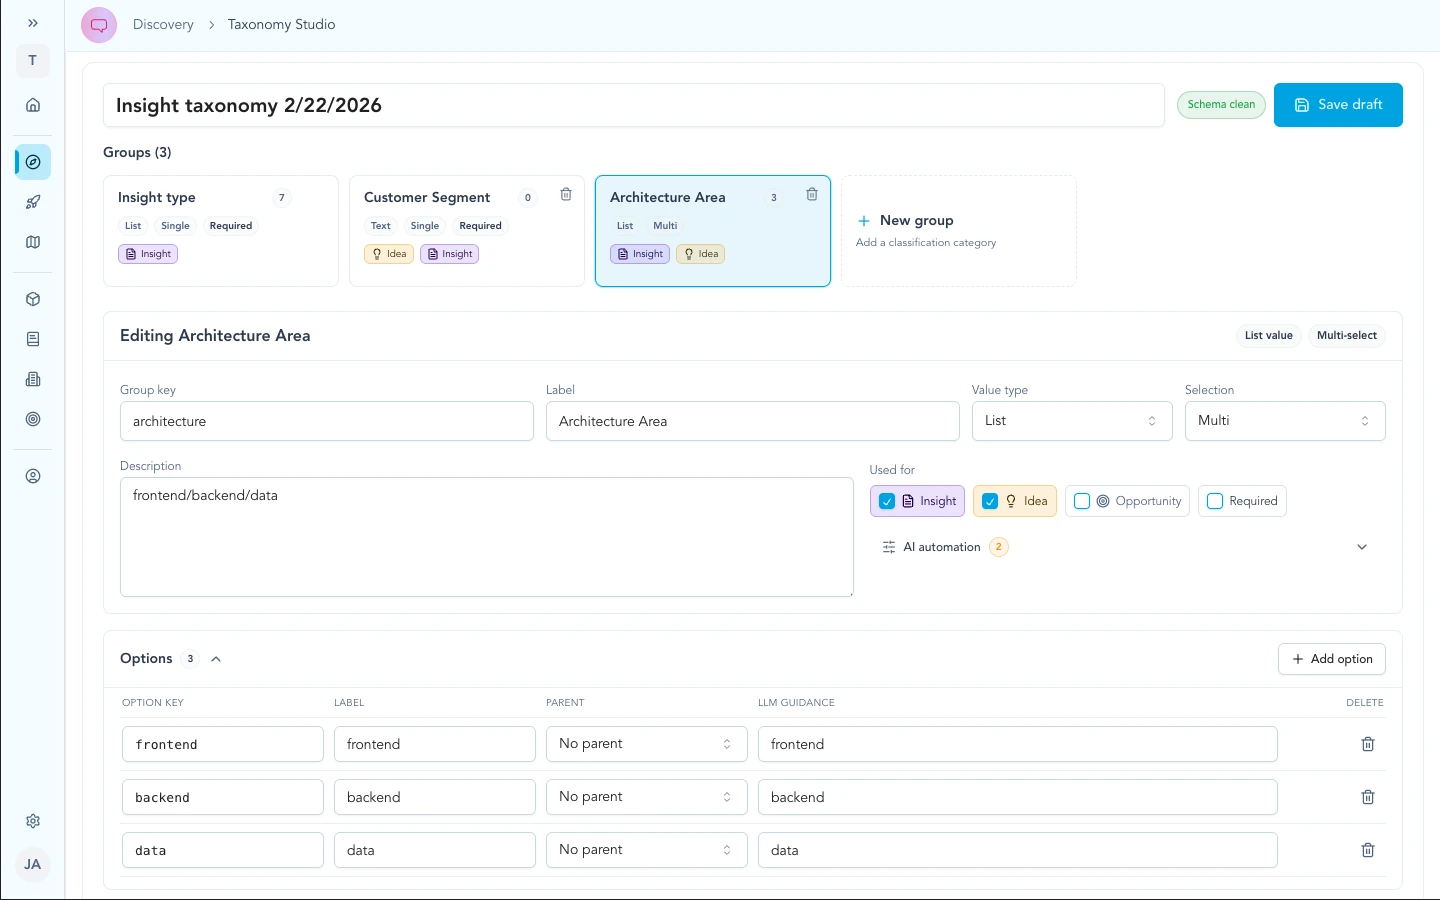
Define dimensions and value lists once; every insight, idea, and opportunity that uses them rolls up the same way in filters and leadership views.
AI classification
Zentrik suggests taxonomy values using your definitions and allowed values plus workspace context (personas, products, OKRs, KPIs, features, narrative notes). Reviewers accept, edit, or clear suggestions on each record.
On an insight, classification appears on the detail view so you can adjust labels without leaving the card.
For ongoing curation of the insight layer itself (merge, link to older cards), see Evidence → insights.
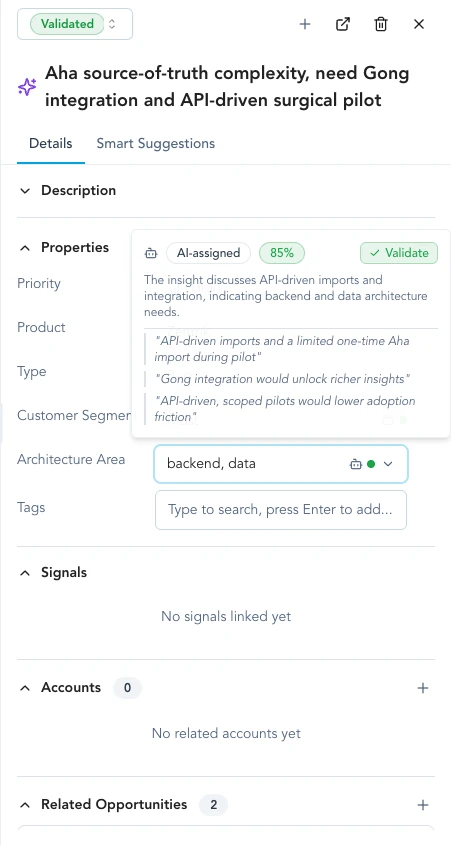
On an insight detail view, review proposed taxonomy values, edit them, and keep the card ready for maps and reports.
Preview and bulk refresh
When you change dimensions or guidance:
- Adjust the taxonomy or add context in the workspace so suggestions have better grounding.
- Try settings on a limited set of records and inspect proposed labels.
- Preview on a subset until PMs and admins agree on the behavior.
- Run bulk refresh across insights, ideas, or opportunities when you want the whole corpus updated (for example after a taxonomy cleanup or reorg).
Many teams stay in preview and per-record review for a while before running bulk jobs. Match the pace to your review process.
Use intake and overview flows to try settings, preview impact on real rows, then bulk-refresh the corpus when the team is aligned.
Maps and rollups
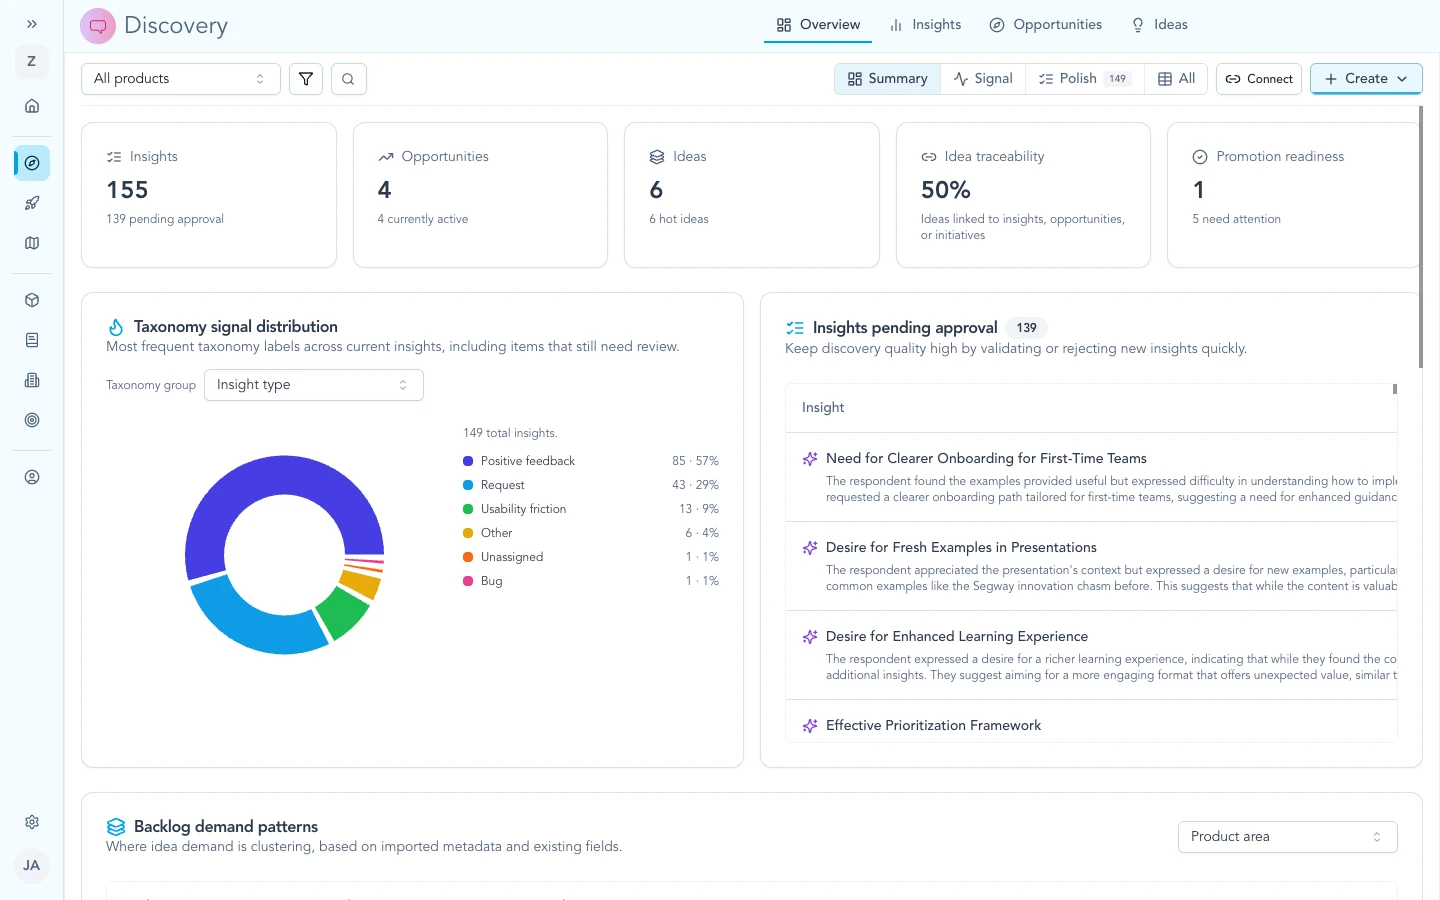
Maps, sidebars, and distribution charts reflect current labels and evidence. They change when new insights arrive, signals add quotes, you edit labels, you bulk-refresh, or theme clustering runs again.
Use the map in working sessions: filter by taxonomy for rollups, open themes to explore language, then capture agreement in opportunities when the team is ready (Insights → opportunities).
If your workspace requires review before items appear in certain views, finish those steps so rollups include the cards you expect.
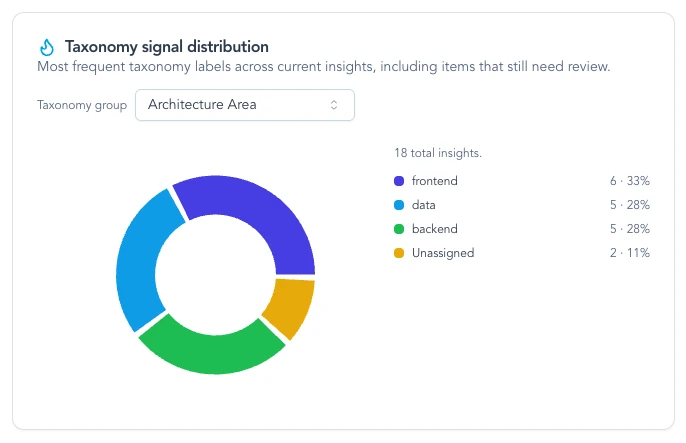
Distribution views summarize classified insights once dimensions are filled in, often after preview looks right.
Troubleshooting
These items are about workflow and expectations in the product, not a broken OAuth client. If something contradicts what you see in your workspace, note your workspace name and the screen, then contact us.
Map looks empty after import
Wait for processing on the signal. Check review or intake queues if your workspace hides unapproved items from some views. Evidence → insights.
Teams disagree on labels
Write a one-line example per dimension (what “P1” means here). Align on opportunity framing before renaming many dimensions. Use preview before a large bulk run.
Leadership quoted a theme name like a formal metric
Taxonomy values are defined and owned by your workspace. Themes describe how language clusters. If a theme should become official, add it to taxonomy; if not, keep it as exploration-only language in decks.